Data Analysis with Power BI
As we know that data analysis is a method to extract useful information from the given raw data by various procedures such as Descriptive Analysis,Diagnostic Analysis, Predictive Analytics, Prescriptive Analysis, Statistical Analysis
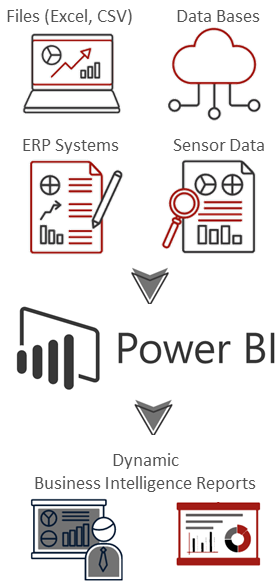
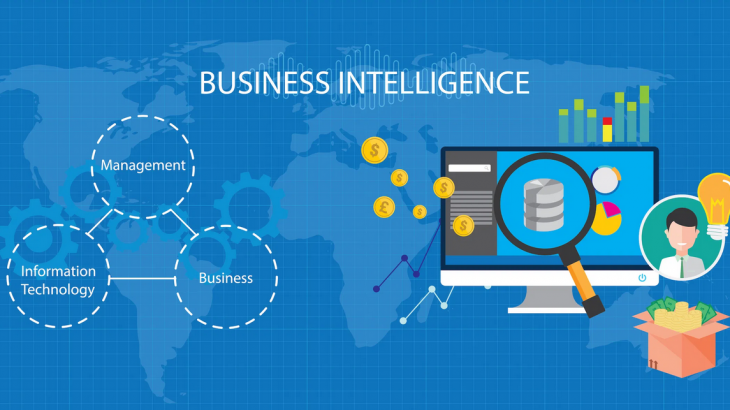
BI stands for Business Intelligence. Power BI is a service which helps end users in managing and configuring different departments in an enterprise.It was developed by Microsoft and has a very user friendly interface.
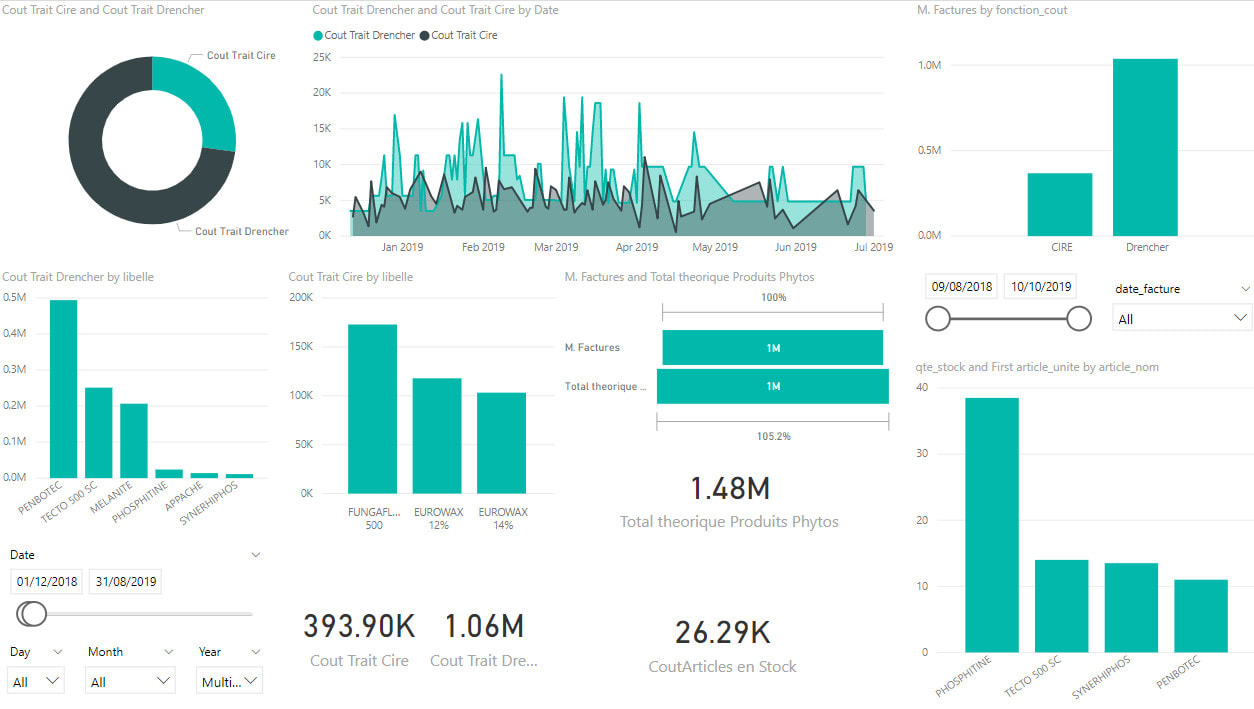
It consists of softwares,connectors and apps to provide efficiency and accuracy in the business. It provides visual effects such as graphs,charts etc which are very eye catchy.We have few versions of this technology and users can choose any of them depending upon their relevance.
They are as follow:-
1)Power BI Desktop:-This is a free window based app for PCs and laptops. It is useful for small scale businesses.
2)PowerBIService Pro:- This is an advanced version of the previous one and it charges per user and contains new features also.
3)Power BI mobile:- This is a device based version for smartphones.
4)Power BI Service Premium:- It is highly scalable and good for large scale companies.
5)Power BI Embedded:-You can have embedded softwares and applications.
Few major features of PI:-
1)Power Query:-it is a feature that allows you to arrange and restructure different pieces of data. Using any valid langy=uage you can create relationships and complex data.
2)Power Map:-It is a visualisation tool which allows you to map huge amounts of data on a chart or graph.
3)Power Q&A:- It is a feature that allows you to simply ask questions to retrieve data.
4)Power View:-It is a feature by which you can create graphs and charts based on data.
On the other hand, data analysis impacts a company to innovate, for being creative regarding their product, the methods they use for productivity.Both play different but important roles in the development of the company.To get the insights of raw data we have to analyse data and find patterns in the datasets. We group the data, bin the datasets also we apply clustering techniques for the efficient uses.
Conclusion
Data analysis and Power BI works together to form preeminent and profound results for companies. It makes the working environment so skilled and easy to use, manages workload and finds out useful patterns in the various data. Both are leading technology in the present world.
Important Links
- Python Course
- Machine Learning Course
- Data Science Course
- Digital Marketing Course
- Python Training in Noida
- ML Training in Noida
- DS Training in Noida
- Digital Marketing Training in Noida
- Winter Training
- DS Training in Bangalore
- DS Training in Hyderabad
- DS Training in Pune
- DS Training in Chandigarh/Mohali
- Python Training in Chandigarh/Mohali
- DS Certification Course
- DS Training in Lucknow
- Machine Learning Certification Course
- Data Science Training Institute in Noida
- Business Analyst Certification Course
- DS Training in USA
- Python Certification Course
- Digital Marketing Training in Bangalore
- Internship Training in Noida
- ONLEI Technologies India